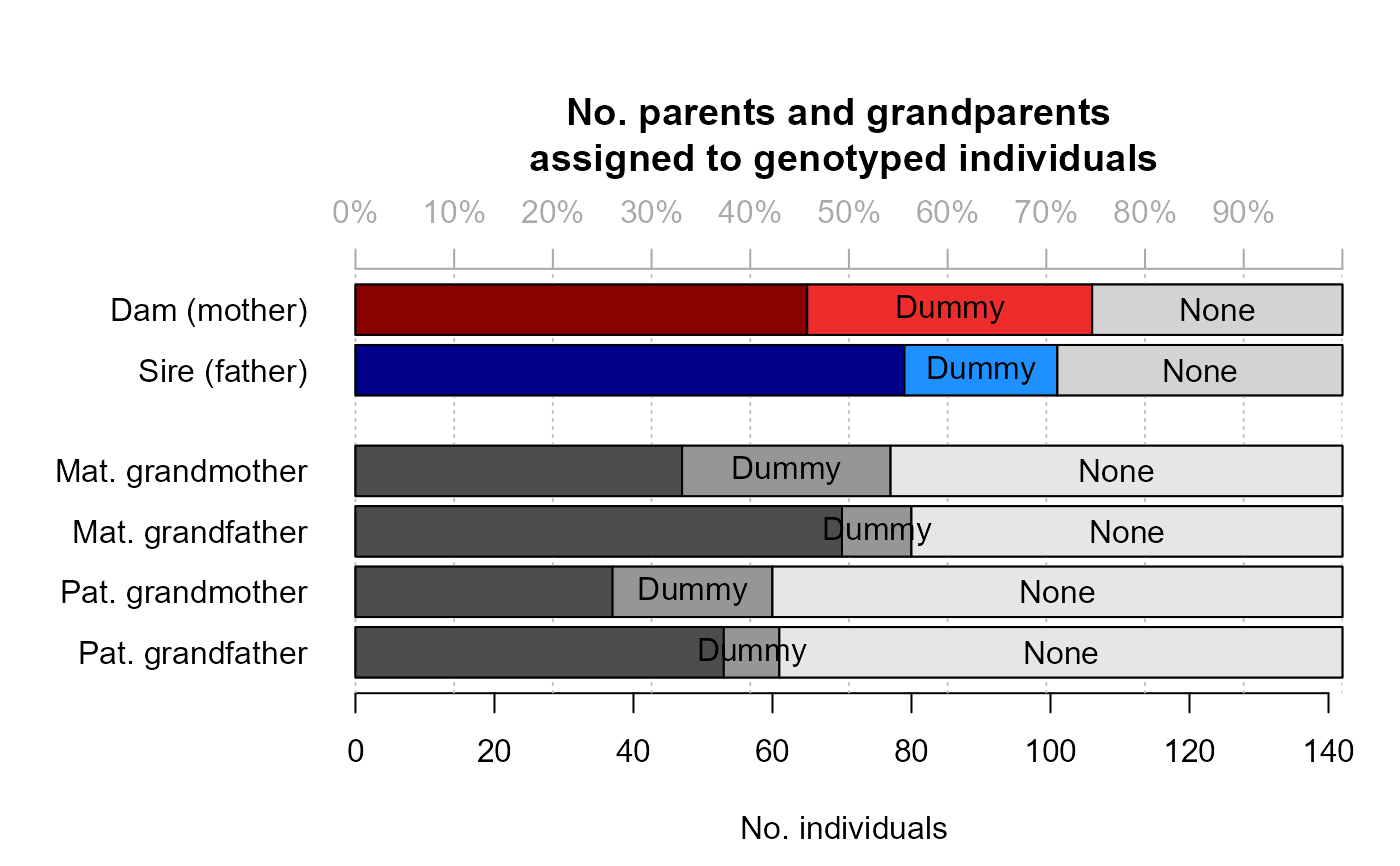
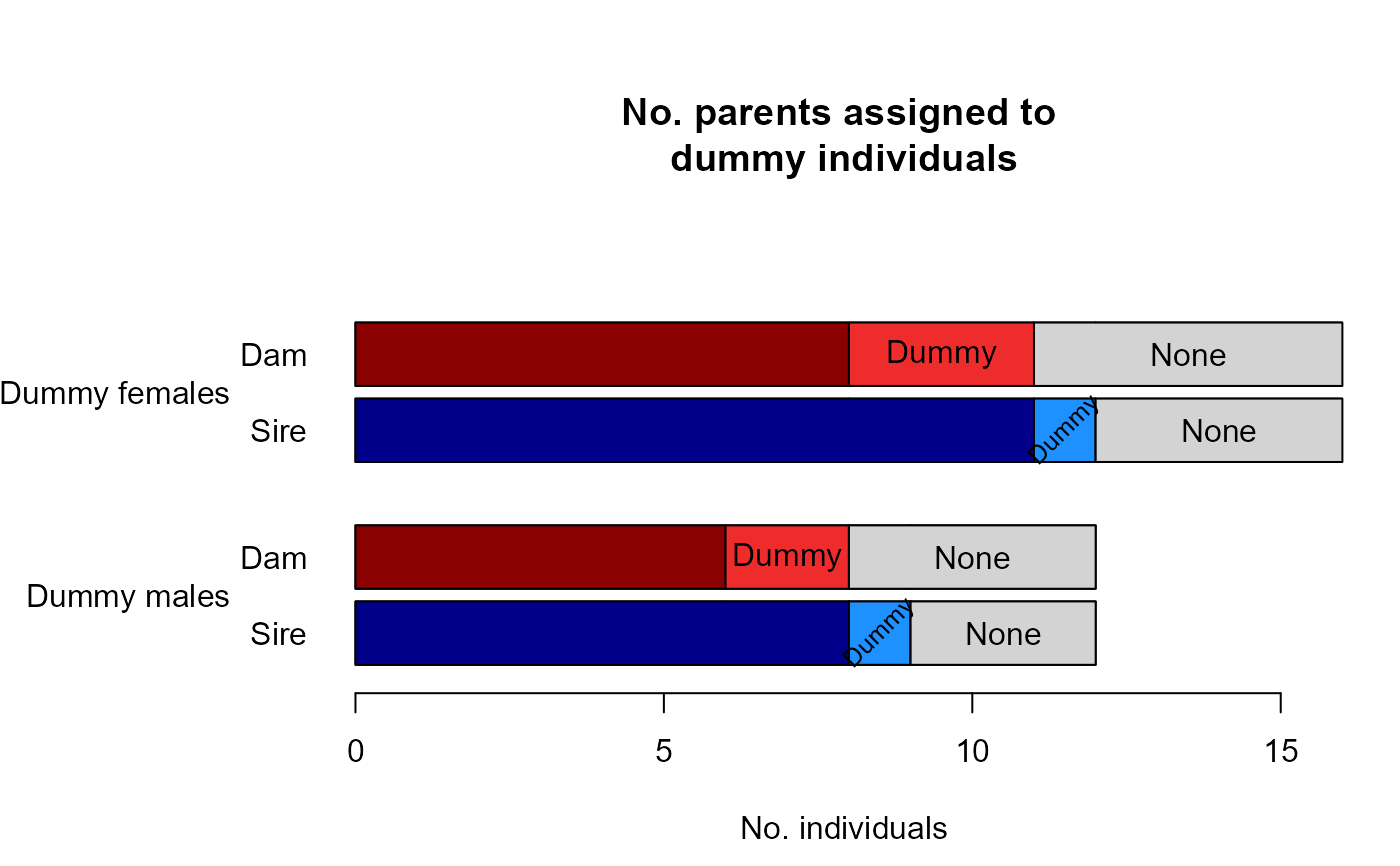
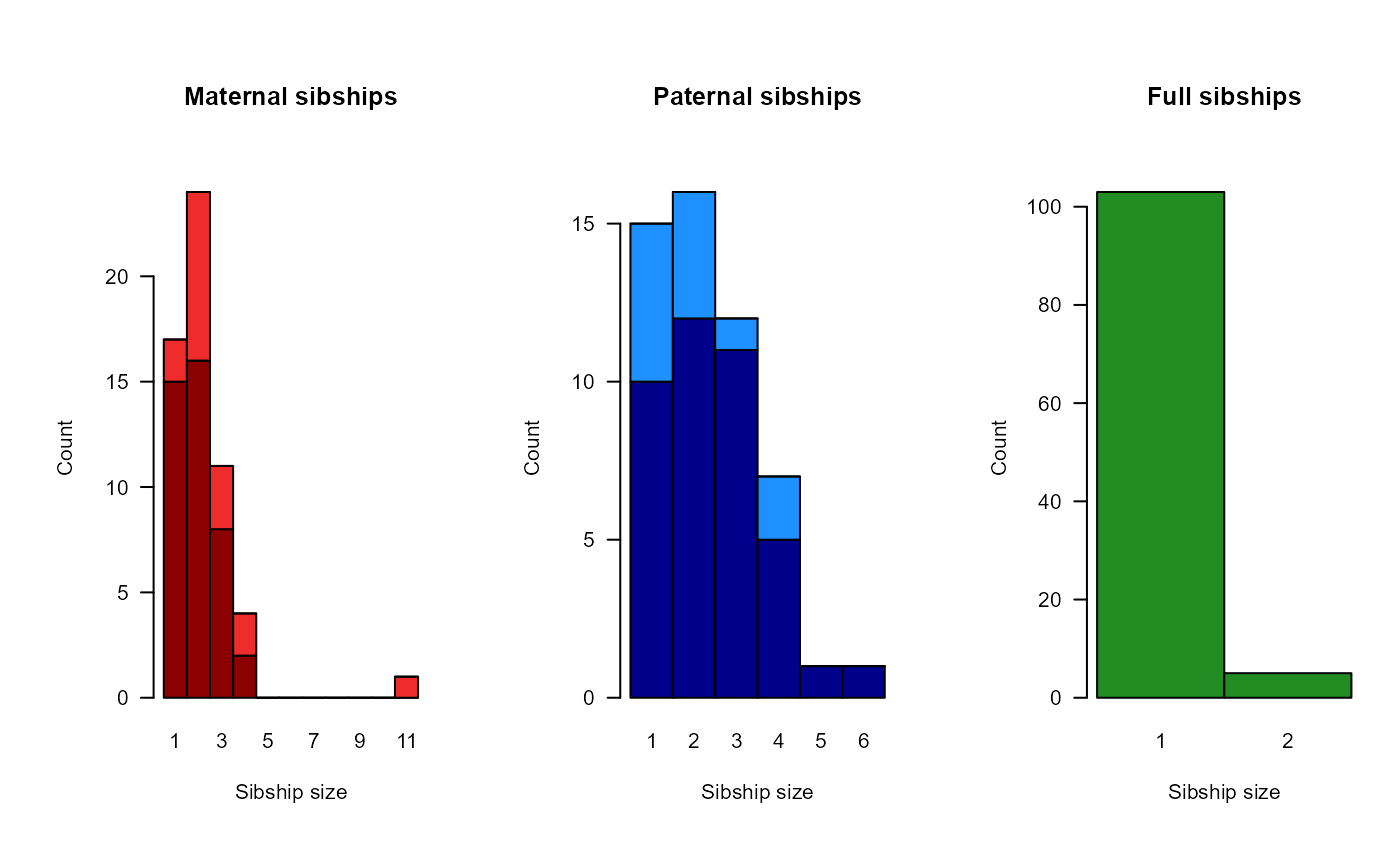
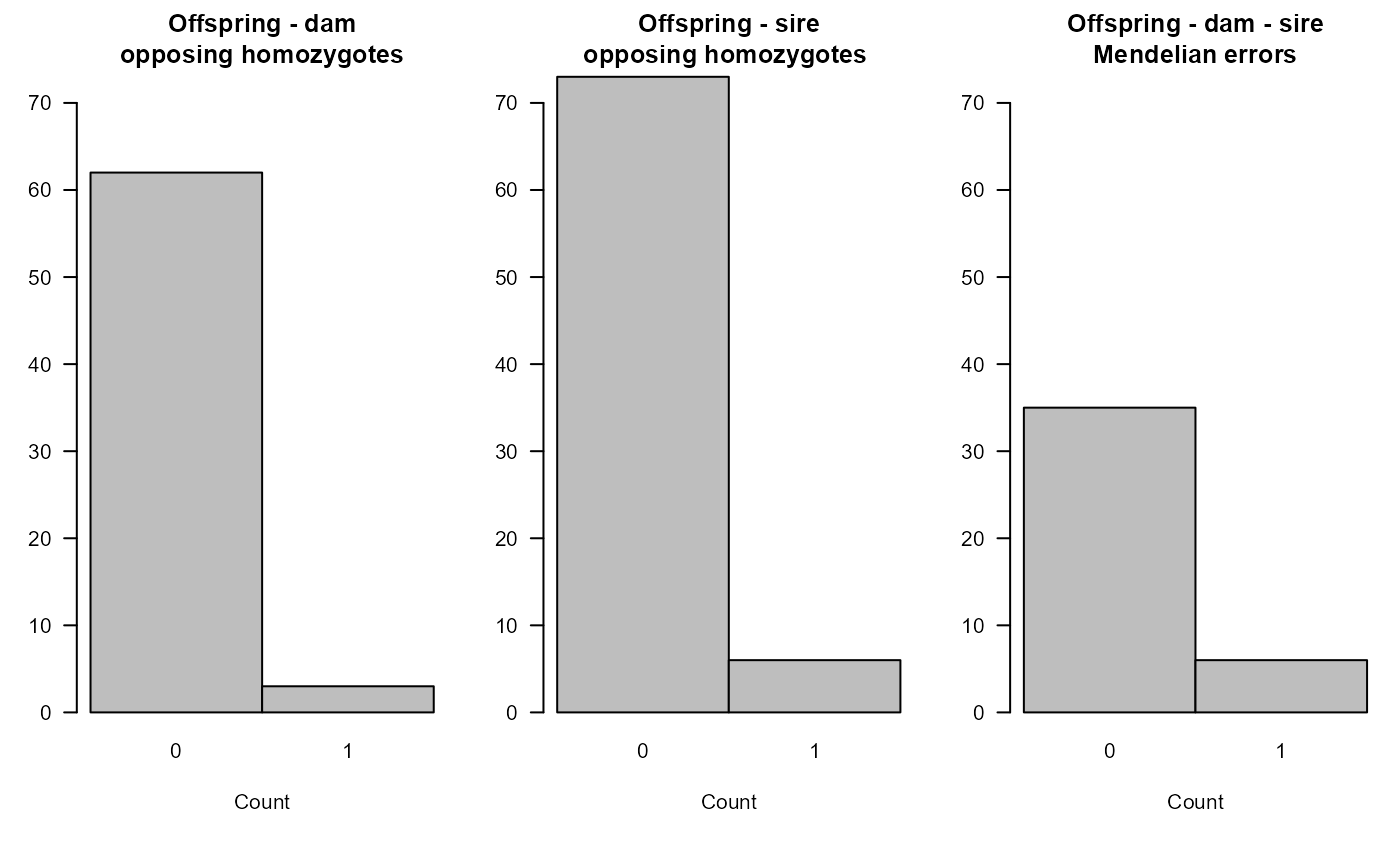
Plot Summary Overview of sequoia Output
PlotSeqSum.Rdvisualise the numbers of assigned parents, sibship sizes, and parental LLRs
Arguments
- SeqSum
list output from
SummarySeq.- Pedigree
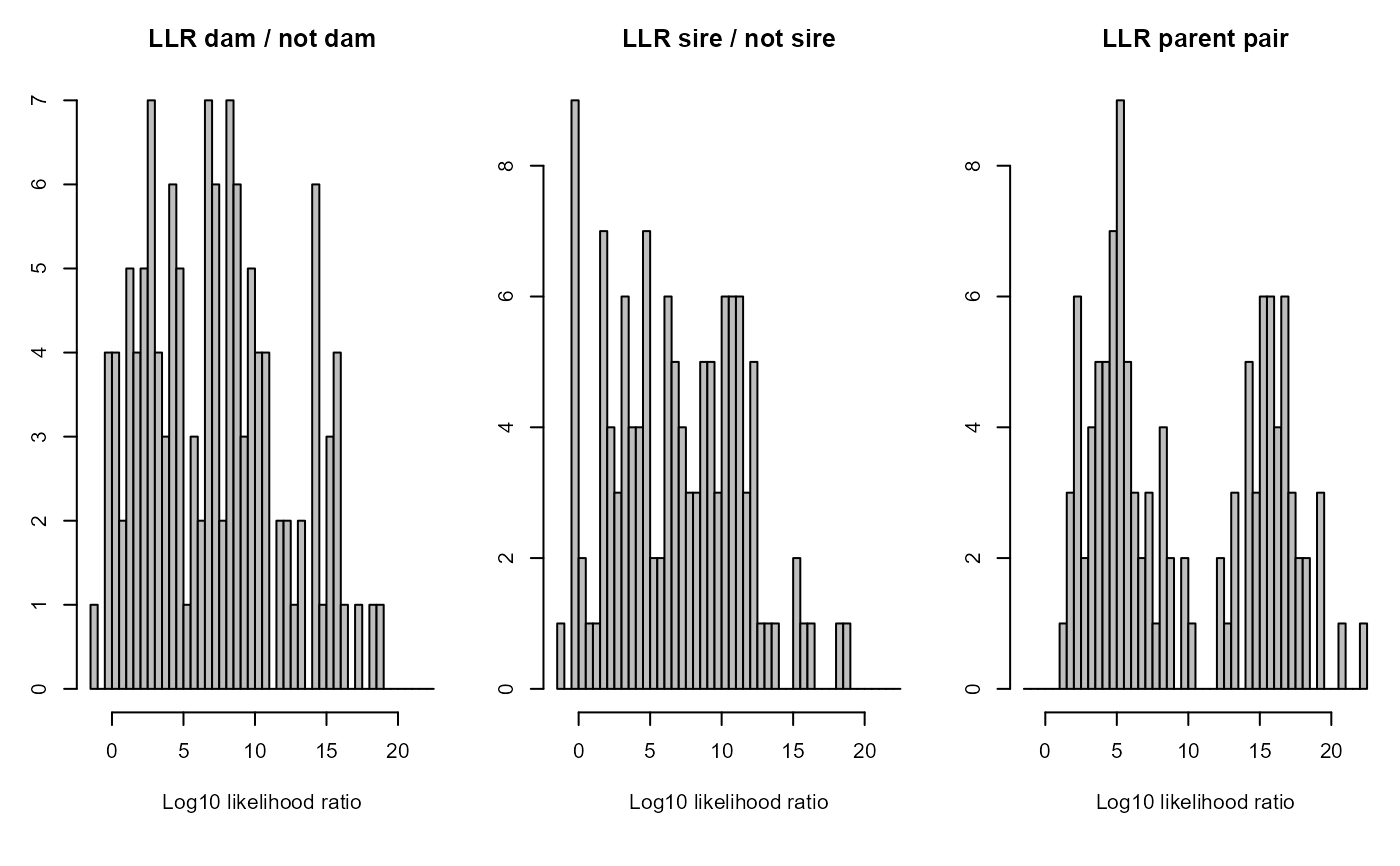
dataframe with at least id, dam and sire in columns 1-3, respectively. If columns with parental LLRs and/or Mendelian errors are present, these will be plotted as well.
- Panels
character vector with panel(s) to plot. Choose from 'all', 'G.parents' (parents of genotyped individuals), 'D.parents' (parents of dummies), 'O.parents' (parents of non-genotyped non-dummies), sibships', 'LLR', 'OH'.
- ask
ask for user key stroke before proceeding to next plot.
Examples
sumry <- SummarySeq(SeqOUT_griffin, Plot=FALSE)
PlotSeqSum(sumry, SeqOUT_griffin$Pedigree, Panels='all', ask=FALSE)