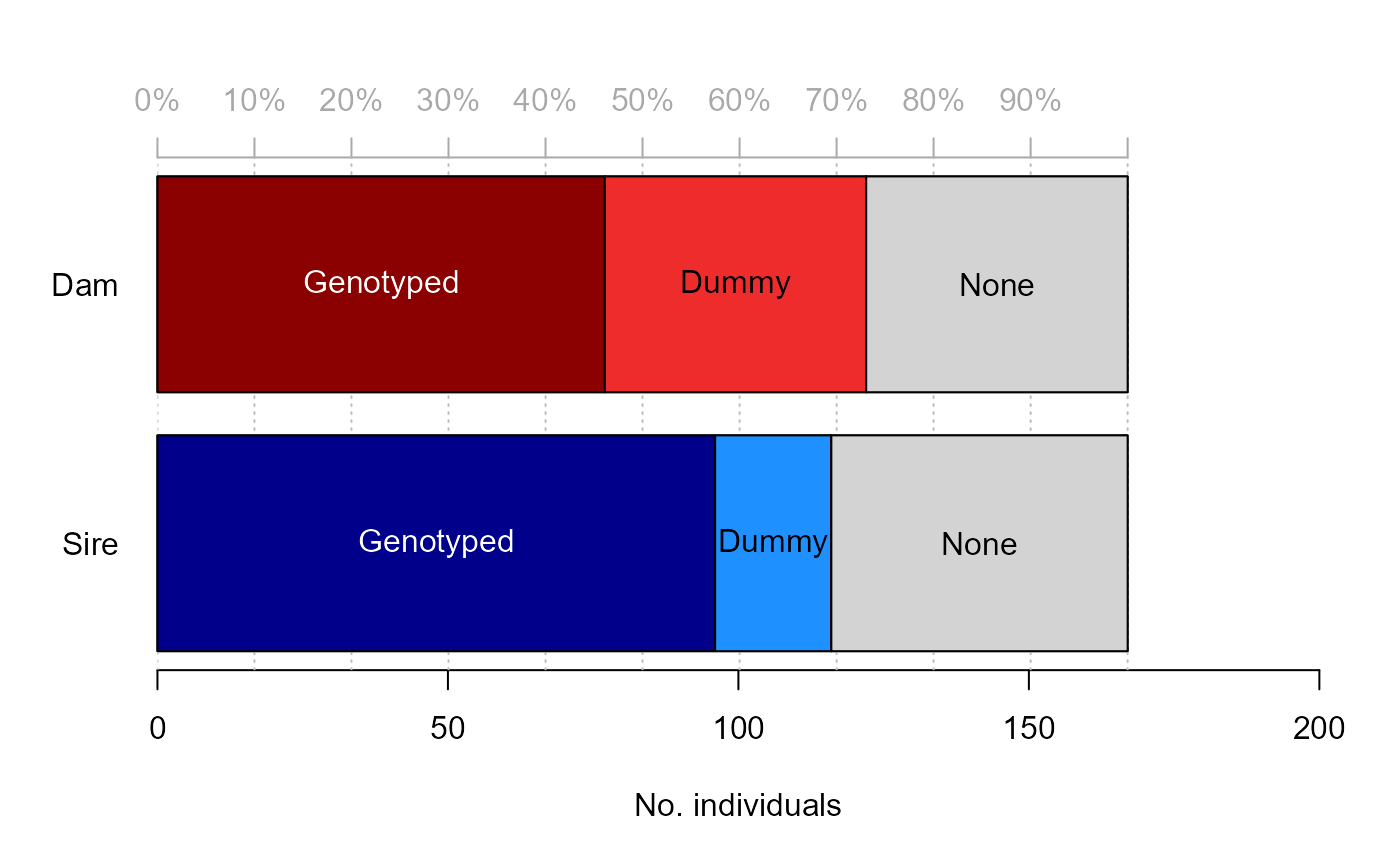
Plot proportion of individuals that has a parent assigned
PlotPropAssigned.RdFor any pedigree, plot the proportion of individuals that has a genotyped, dummy, observed, or no dam/sire assigned.
Usage
PlotPropAssigned(Pedigree = NULL, DumPrefix = c("F0", "M0"), SNPd = NULL, ...)Arguments
- Pedigree
dataframe where the first 3 columns are id, dam, sire.
- DumPrefix
character vector with prefixes for dummy dams (mothers) and sires (fathers), used to distinguish between dummies and non-dummies.
- SNPd
character vector with ids of genotyped individuals (e.g. rownames of genotype matrix).
- ...
further arguments passed to
barplot
Details
This function offers a more flexible interface to some of the plots
included in SummarySeq
Examples
PlotPropAssigned(SeqOUT_griffin$Pedigree, SNPd = rownames(Geno_griffin))