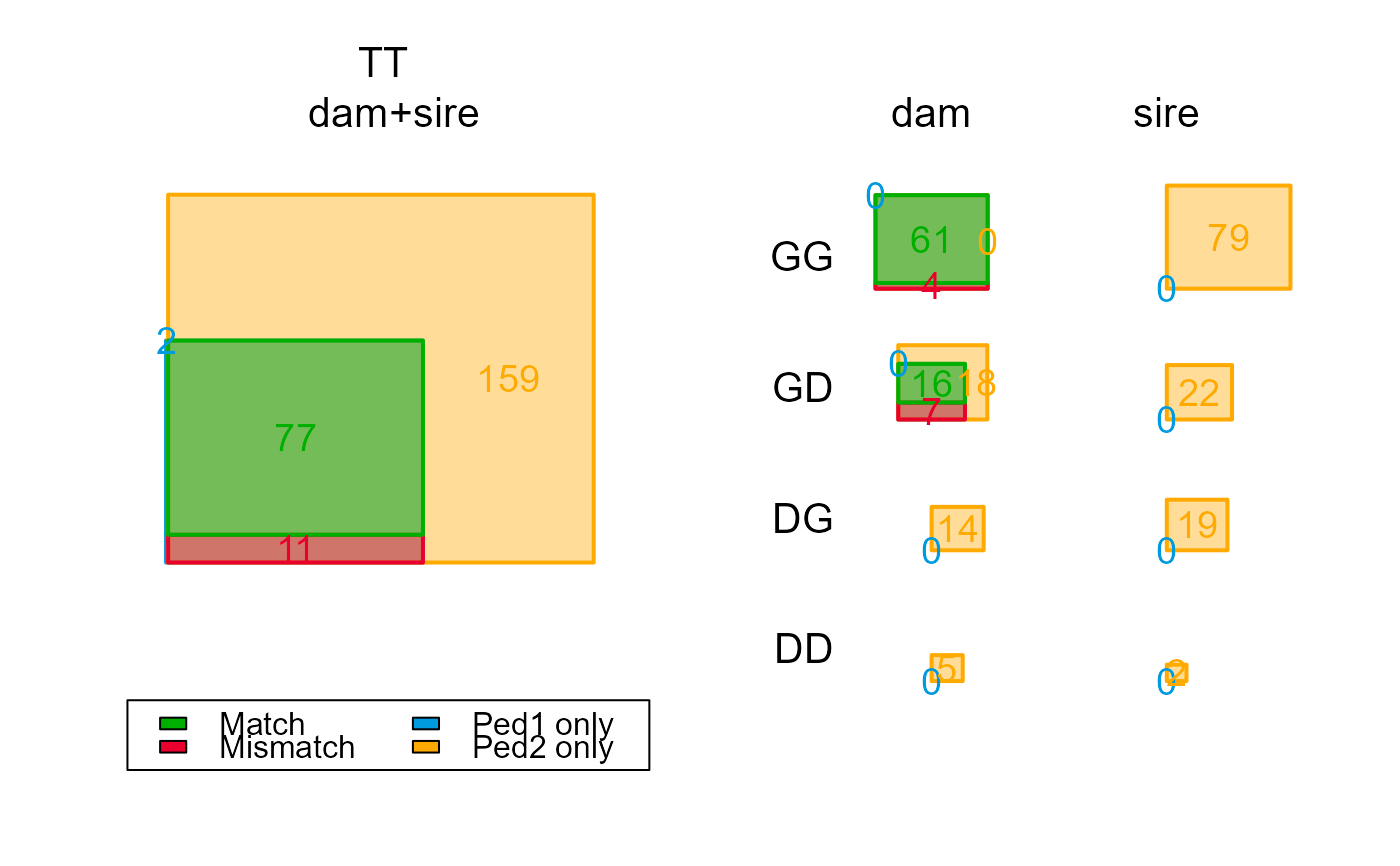
Visualise PedCompare Output
PlotPedComp.Rdsquare Venn diagrams with PedCompare
Counts.
Arguments
- Counts
a 7x5x2 array with counts of matches and mismatches per category (genotyped vs dummy), as returned by
PedCompare.- sameSize
logical, make all per-category Venn diagrams the same size
TRUE, or make their size proportional to the counts (FALSE, the default). IfTRUE, a warning is printed at the bottom.
Examples
PC.g <- PedCompare(Ped1 = cbind(FieldMums_griffin, sire=NA),
                   Ped2 = SeqOUT_griffin$Pedigree)

PlotPedComp(PC.g$Counts)