Plot Pair Log10-Likelihoods
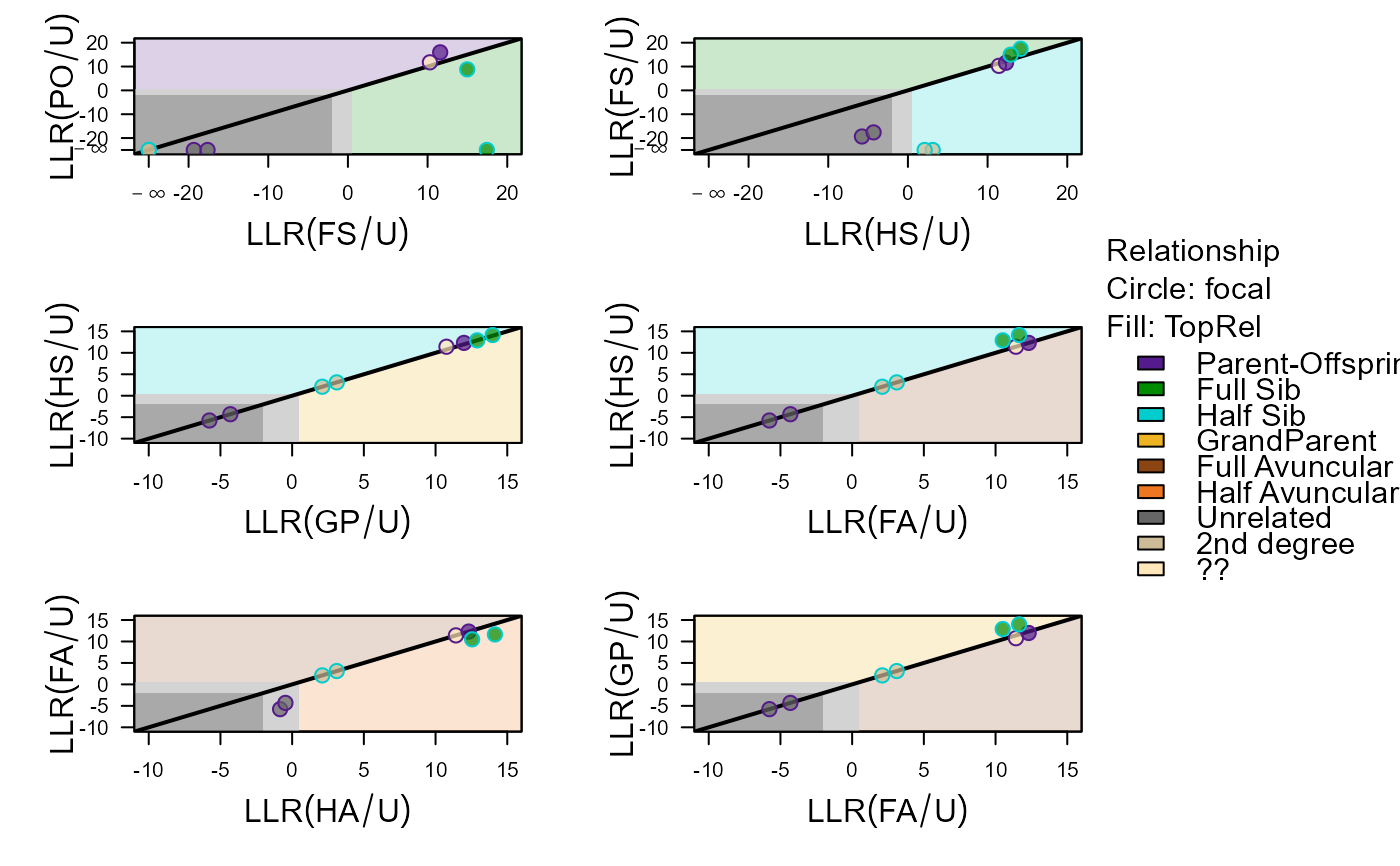
PlotPairLL.RdColour-coded scatter plots of e.g. LLR(PO/U) against LLR(FS/U), for various relationship combinations.
Arguments
- PairLL
dataframe, output from
CalcPairLL.- combo
list with length-2 character vectors, specifying which likelihoods to plot against each other. Choose from 'PO', 'FS', 'HS', 'GP', 'FA', and 'HA'. The first one gets plotted on the x-axis, the second on the y-axis. Subsequent figures will be drawn row-wise.
- nrows
number of rows in the figure layout. If
NULL, set toceiling(length(combo)/ncols).- ncols
number of columns in the figure layout. If both
nrowsandncolsare NULL,ncolsis set toceiling(sqrt(length(combo))), andnrowswill be equal toncolsor one less.- bgcol
logical, colour the upper and lower triangle background of each figure to match the specified relationship combo.
- Tassign
assignment threshold, shown as grey square in bottom-left corner and a band along the diagonal.
- Tfilter
filter threshold, shown as dark grey square in bottom-left.
Details
The colour of each point is determined by columns focal
(outer circle) and TopRel (inner filling) of PairLL.
Impossible relationships (LL > 0 in PairLL) are shown as -Inf
on the axes, if any are present.
Examples
Pairs <- data.frame(ID1 = "a01005",
                    ID2 = c("a00013", "a00008", "a00011", "b00001",
                            "b01006", "b01007", "b01013", "b01014"),
                    focal = rep(c("PO", "HS"), each=4))
PLL <- CalcPairLL(Pairs, GenoM=SimGeno_example, Plot=FALSE)
#> ℹ Not conditioning on any pedigree
PlotPairLL(PLL,
           combo = list(c("FS", "PO"), c("HS", "FS"), c("GP", "HS"),
                        c("FA", "HS"), c("HA", "FA"), c("FA", "GP")),
           nrows = 3)