Plot Age Priors
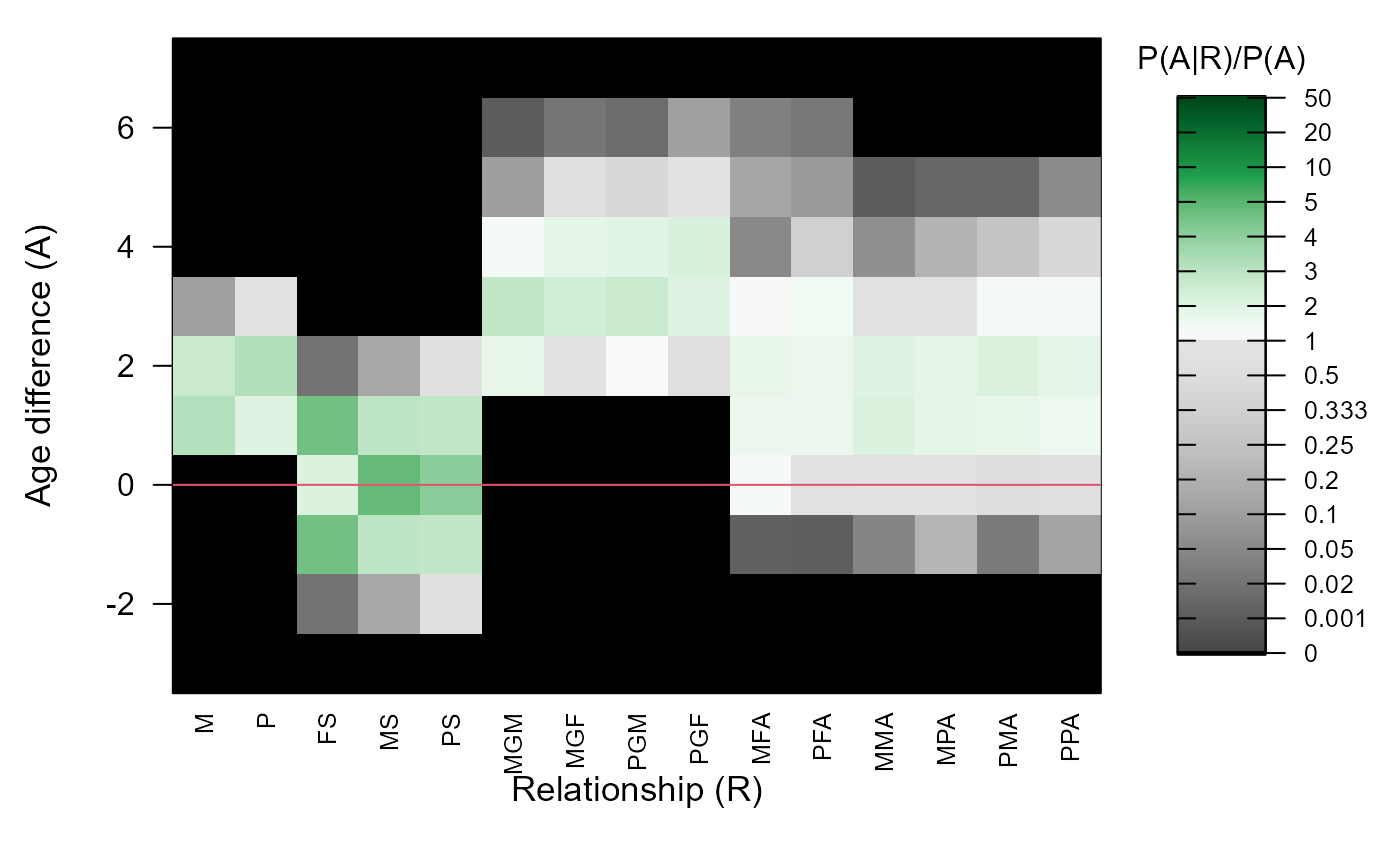
PlotAgePrior.RdVisualise the age-difference based prior probability ratios as a heatmap.
Arguments
- AP
matrix with age priors (\(P(A|R)/P(A)\)) with age differences in rows and relationships in columns; by default M: maternal parent (mother), P: paternal parent (father), FS: full siblings, MS: maternal siblings (full + half), PS: paternal siblings.
- legend
if
TRUE, a new plotting window is started andlayoutis used to plot a legend next to the main plot. Set toFALSEif you want to add it as panel to an existing plot (e.g. withpar(mfcol=c(2,2))).